There are many different application scopes and use cases involving CAD Exchanger products, the primary one being to display a 3D model. In an effort to meet the expectations of developers in creating visually stunning apps, we released a purpose-made add-on - Visualization Toolkit.
In this blog post, we are going to describe the operation principle of the add-on, how it complies with various front- and back-end platforms, and what model interactions and scene customization it provides.
What is Visualization Toolkit?

Visualization Toolkit is a CAD Exchanger SDK add-on that enables the creation of interactive 3D apps on top of OpenGL or DirectX, in C#/WPF, Qt/QML, C#/Windows Forms, Java, or another platform of choice. The visualization component established itself as an efficient tool being used underneath CAD Exchanger Lab and various customized applications.
Visualization Toolkit API allows to create the hierarchical definition of a 3D model from the SDK data objects (ModelData_Model or its components) or directly from user-defined data. The scene which enables display and selection represents a platform-independent code. The rendering of the scene is taken care of by a backend (such as OpenGL). A number of frontends in the form of platform-specific viewport UI widgets provide 3D view manipulation (zoom/pan/rotate) and controls (view-cube, manipulator).
This kind of add-on architecture allows it to integrate with other back-ends and front-ends while keeping the user’s code virtually unchanged and cross-platform. The visualization component provides integration with the following technologies:
- C++ with QtQuick/QML (Qt version 5.12 or higher)
- C# with WPF (Windows Presentation Foundation 4.5 or higher)
- C# with Windows Forms (.NET Framework 4.7 or higher)
- Javascript with three.js
Other platforms can be also enabled upon request, including C++ with Qt/Widgets, Java on desktop or Android, C++ with Open Scene Graph, C++ with VTK, as well as other OpenGL, OpenGL-ES, DirectX, WebGL-based platforms.
Please refer to the documentation for more details on component architecture and API. This article could also be useful if you'd like to get a general idea of how Visualization Toolkit can work under the hood.
Visualization Toolkit use cases

Visualization techniques have become an integral part of engineering, manufacturing, and maintenance. And again, the thing to be blamed for it is a multithreaded and multi-staged product cycle, involving numerous stakeholders. Visualization of complex environments and processes can act as a powerful communication tool, aid in decision-making, and provide an intuitive user interface.
Having analyzed a dozen of visualization libraries and hundreds of customers’ requests, we are able to define six key usage scenarios when it’s necessary to visualize 3D CAD models.
Engineering collaboration
Design work of complex products, for example in shipbuilding or BIM, might require the continuous exchange of CAD data between design, prototyping, and validation teams. From one app to another, the workflow demands data integrity, geometrical accuracy, and a low memory footprint. High-performance visualization could make a difference between a successful product launch and a failure.
Simulation
Realistic visualization provides a more comprehensive understanding of simulation results. The more accurate is the dynamic behavior of a model, the more valuable the insights are. It simplifies identifying bottlenecks and finding ways to improve them.
Marketing and demonstrations
Visualization of 3D models and systems is widely used to convince customers or investors of the benefits of the project via interactive models and virtual tours. Immersive illustrations are able to explain much better than words alone when it comes to visual attraction or delivering technical details to people with a non-technical background.
Environment planning
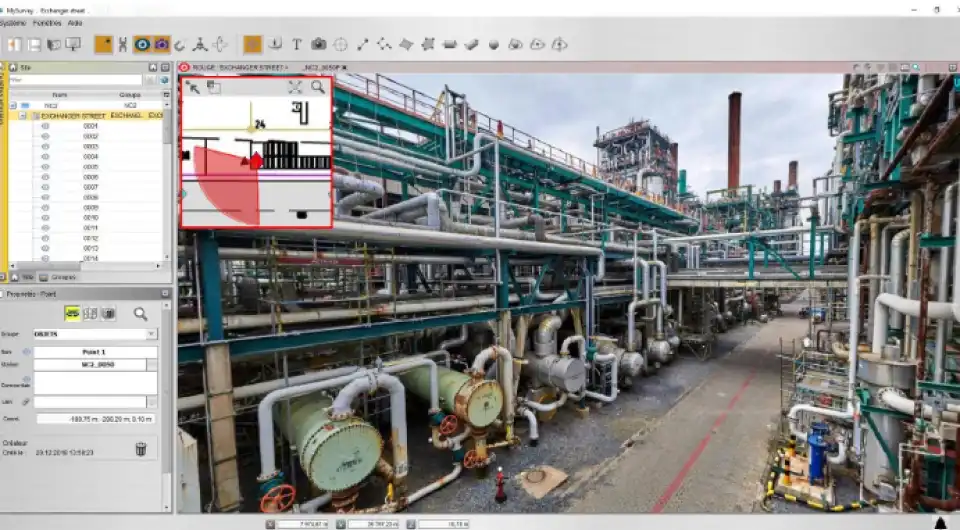
Plants and buildings layouts, as well as production routings, could be enhanced with a help of visualization. With a possibility to create virtual environment designers and architects can explore alternative design solutions and elements location, as well as prevent mistakes before moving into construction. Visualization may also be helpful for existing sites exploration with virtual measurement tools and access to additional information integrated into the model. Check out how the visualization component was adopted to create virtual tours of industrial sites.
Education & training
3D visualizations are used for education, onboarding of new employees, new technology training, and new facilities tours. This tool surpasses its more conventional alternatives in several aspects. Visualization reduces the necessity of mentor participation and provides cost-free repetitions. In comparison to the video, it allows interactions (zoom, pan, and rotation), which help to pay attention to every small detail and at the same time to see the big picture with all the interdependencies.
Maintenance & repair
Accurate visualization with access to annotations, PMI, and any other user-generated data can be of great help for a maintenance engineer. It plays a role of an intuitive user interface providing all the relevant information about the equipment, recent malfunctions, repair logs, and the maintenance cycle it requires.
Visualization Toolkit features
Basic interaction operations
The frame where objects are displayed and manipulated is defined by a viewport, while the control is performed via viewcube and mouse and keyboard. Here are the operations that are supported by the viewport "out of the box":
- Zoom
- Pan
- Rotate
- Individual and batch selection
- Switch between camera views
A viewport itself allows to zoom, pan, rotate, and select a 3D object or its part. A viewcube - to switch standard view camera positions (front, left, top, etc).
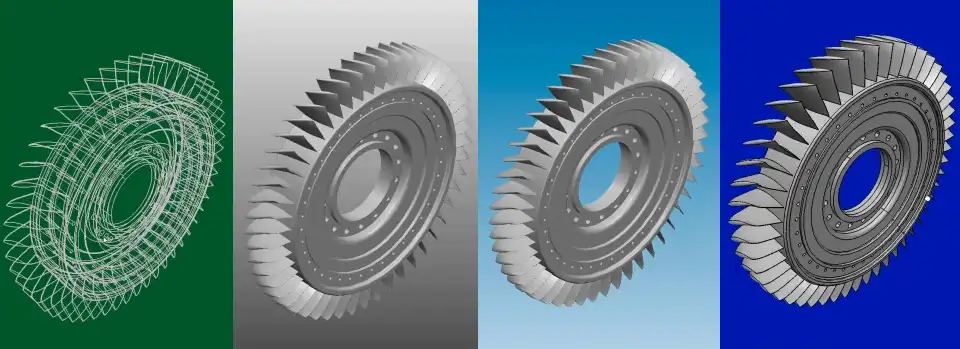
Apart from the interactive controls, there are several 3D view settings available for customization:
- Solid or gradient background color
- Perspective or isometric projection of a camera
- Viewcube and trihedron visibility
- Global grid visibility
Since viewport is platform-specific, its creation is different for each front-end. You can check the code examples for different types of components in the ‘Initializing viewport’ section of the documentation.
Initializing viewport for WPF (Windows Platform Foundation) component
Manipulator
While the movement of the camera around the model is performed with a mouse and a viewcube, the movement of the model itself within a scene is carried out with a manipulator.
It allows three-axis movement and rotation of the scene nodes, which is not just the whole model, but its separate parts too. During a transformation, the ruler or the protractor appears to measure the current displacement with respect to that starting position.
<cadex:ModelPrsWPF_ViewPort x:Name="myViewPort"
HorizontalAlignment="Stretch" VerticalAlignment="Stretch"/>
Scene management
The Visualization Toolkit provides a data model for the scene different from ModelData_Model - ModelPrs_Scene. This establishes flexibility in ModelData_Model display: the ability to control the structure of the scene tree, its granularity, the type of representations used to display the models.
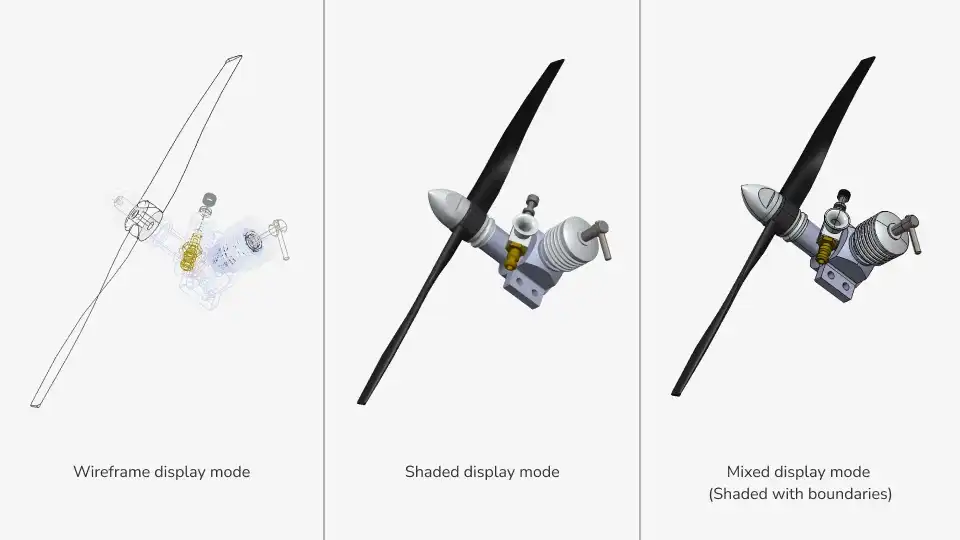
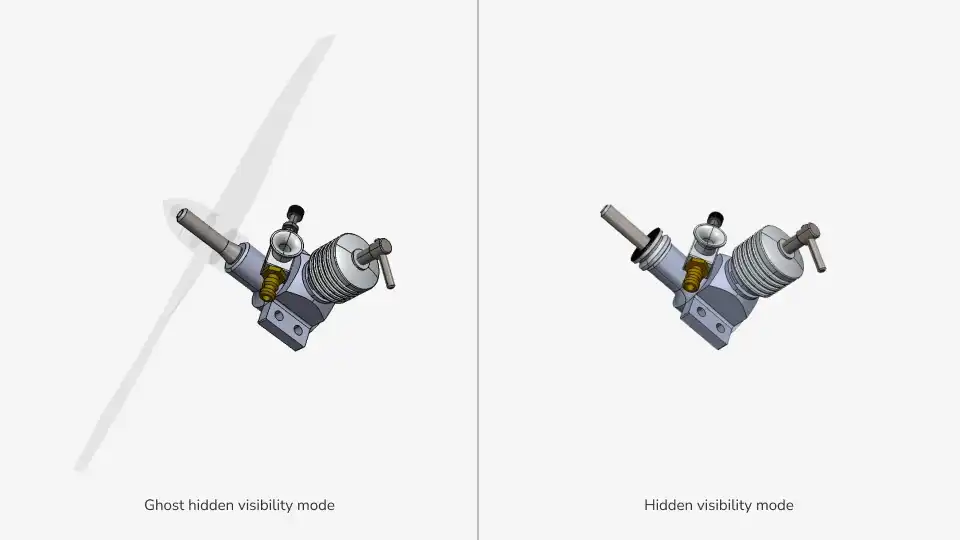
It is possible to customize the appearance of the scene nodes, opting for wireframe, shading, or mixed display modes. It's also possible to customize the appearance of the hidden nodes, either hiding them completely or displaying so-called ghosts instead. There is also an option to associate arbitrary data with scene nodes, reusing the scene data structure for application-specific workflows.
The following code snippet demonstrates how to create mixed display modes (with or without boundaries and surface boundaries):
ModelPrs_SceneNode aRoot;
ModelPrs_SceneNodeFactory aFactory;
auto aFirstNode = aFactory.Create (aFirstBody);
aRoot.AddChildNode (aFirstNode);
auto aSecondNode = aFactory.Create (aSecondBody);
aRoot.AddChildNode (aSecondNode);
aRoot.SetDisplayMode (ModelPrs_DM_Shaded);
aFirstNode.SetDisplayMode (ModelPrs_DM_Wireframe);
// aSecondNode inherits parent's display mode - ModelPrs_DM_Shaded
Hover and selection
Visualization Toolkit UI controls provide 3D object selection handling, including support for multiple object selection. Aside from manual selection in the viewport, the set of selected objects can also be manipulated programmatically, in response to selection in a different UI control (like tree view of model structure) or to an arbitrary event (e.g. the end of a heavy computation).
Selection in the viewport can be configured to only work on specific types of objects, such as scene nodes, various B-Rep shapes. It's also possible to allow the selection of B-Rep shapes with specific geometry (cylindrical faces or linear edges) and highlight the objects to be selected on mouse cursor hover.
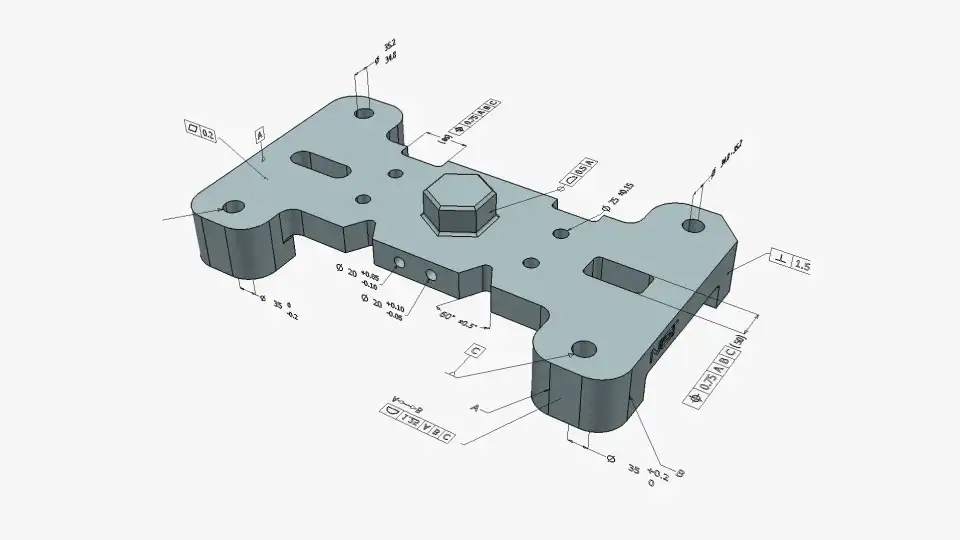
Product and manufacturing information (PMI)
Within collaborative engineering, it's not enough to store, share and display just the 3D geometry - lots of CAD models contain a wealth of other valuable data. Therefore, the Visualization Toolkit is equipped to display graphical PMI elements (GD&T, text annotations, surface finish, material specifications, etc.).
Measurements
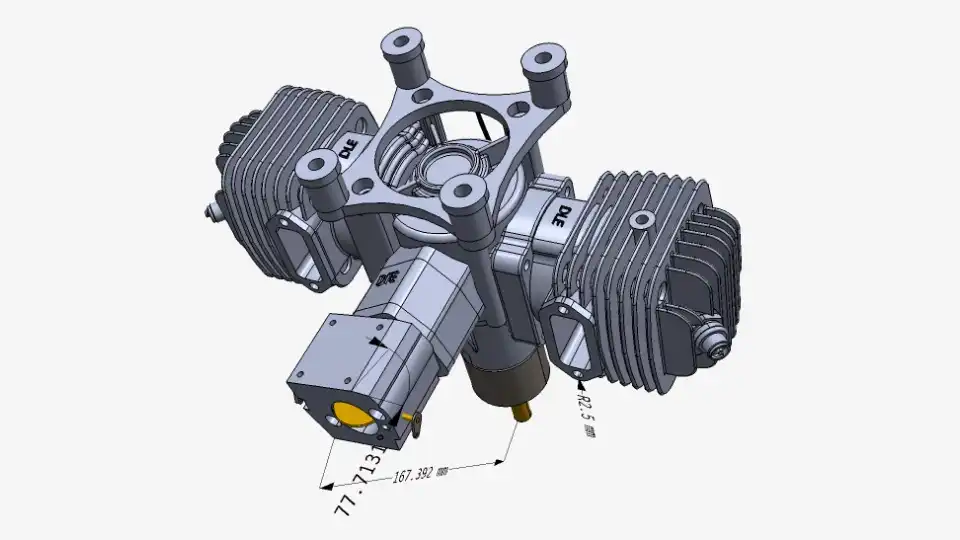
Visualization Toolkit enables measurement operations, as well as its display customization (units, footnote size, color).
Five types of measurements are available:
- Distance
- Radius
- Diameter
- Angle between planes
- Angle between 3 vertices
Exploded and section views
Exploded view tool might be useful in explaining the design details and estimating the pros and cons of its structure for further manufacturing. Displaying model parts separately can also be used for creating illustrations for product manuals.
Section views allow users to see a 3D model cut by a plane. It gives insight into the geometry hidden inside. If necessary, the capping option may be turned on to apply a hatch pattern or any color to the cross-section of solid bodies.

Offscreen rendering and screenshot generation
In addition to platform-specific back-ends and their respective viewports, CAD Exchanger SDK supports offscreen viewport which is useful for screenshot generation. It allows the same level of customization as normal on-screen viewports of different frontends, making the creation of thumbnails just right a breeze.
This is the same tool that is used by CAD Exchanger Lab for generating thumbnails of the imported 3D models.
Here is a code snippet for screenshot generation:
ModelPrs_Scene aScene;
ModelPrs_OffscreenViewPort aViewport;
aViewport.AttachToScene (aScene);
aViewport.Resize (300, 300);
... // Scene operations (Adding roots, Update, Wait)
aViewport.FitAll();
aViewport.GrabToImage ("test.png");
Visualization Toolkit benefits
CAD Exchanger Visualization Toolkit offers the twin advantage of facilitating your application development and delivering an impressive visual experience to the end-users.
- Visualization Toolkit is a cross-platform solution, supporting various front-end technologies (incl. QtQuick/QML, Qt/Widgets, WPF, Windows Forms, etc.) and compatible with numerous visualization libraries (e.g., Open Scene Graph, VTK, Open Inventor/Coin3D, Qt 3D, three.js, etc.)
- Multi-threading used in CAD Exchanger SDK guarantees high performance even with large assemblies. Computations are organized in a way to distribute system resources properly and to support responsive UI.
- Sharing heavy-weight data (e.g. geometrical definition of parts instanced multiple times in an assembly) reduces the memory footprint.
- Ready-to-use platform-specific components and general features minimize the need for massive user’s code, reduce the development time, and simplify further maintenance.
- The visualization component provides a great user experience with its highly interactive scenes (various display modes, selection, and hovering), smooth transitions in 3D view, and both mouse and touch screen manipulations.
- CAD Exchanger enables stunning views (multi-plane sectioning, assembly exploded views, hidden and ghost modes) and flexible visual settings (colors, materials, line thicknesses, transparencies, textures, and antialiasing)
CAD Exchanger visualization component could be of great use for building interactive high-quality 3D scenes. Add this benefit to the easy toolkit integration - and complex geometry visualization becomes a powerful communication tool, when it comes to explaining, analyzing, and convincing.
If you already use CAD Exchanger SDK, you can try the examples of 3D scene creation located in the ‘examples’ folder of your installation package. The full list of available demos may be found here. In case you don’t have our product running, don’t hesitate to request a free, fully-featured evaluation at our website.